
Volume 28, Issue 3 (12-2025)
jha 2025, 28(3): 28-48 |
Back to browse issues page


![]()
![]()
![]()
Download citation:
BibTeX | RIS | EndNote | Medlars | ProCite | Reference Manager | RefWorks
Send citation to:


BibTeX | RIS | EndNote | Medlars | ProCite | Reference Manager | RefWorks
Send citation to:
Shamsi D, Mohammadian Saravi M, Mohammadzadeh K A, Ashrafi A. The causal relationship pattern of factors affecting good governance in Iran's healthcare system. jha 2025; 28 (3) :28-48
URL: http://jha.iums.ac.ir/article-1-4633-en.html
URL: http://jha.iums.ac.ir/article-1-4633-en.html


1- Department of Public Administration, NT.C., Islamic Azad University, Tehran, Iran.
2- Department of Public Administration, NT.C., Islamic Azad University, Tehran, Iran. ,Mo.Mohammadian@iau.ac.ir
3- Department of Health Services Management, NT.C., Islamic Azad University, Health Economics Policy Research Center, TeMS. C., Islamic Azad University, Tehran, Iran.
2- Department of Public Administration, NT.C., Islamic Azad University, Tehran, Iran. ,
3- Department of Health Services Management, NT.C., Islamic Azad University, Health Economics Policy Research Center, TeMS. C., Islamic Azad University, Tehran, Iran.
Full-Text [PDF 1486 kb]
(203 Downloads)
| Abstract (HTML) (307 Views)
Table 1. Summary of thematic analysis results
Table 2. Direct relationship matrix
Table 3. Normalized direct correlation matrix
Table 4. Total-relation matrix
Table 5. Significant relationships (interactions)
Table 6. Final output
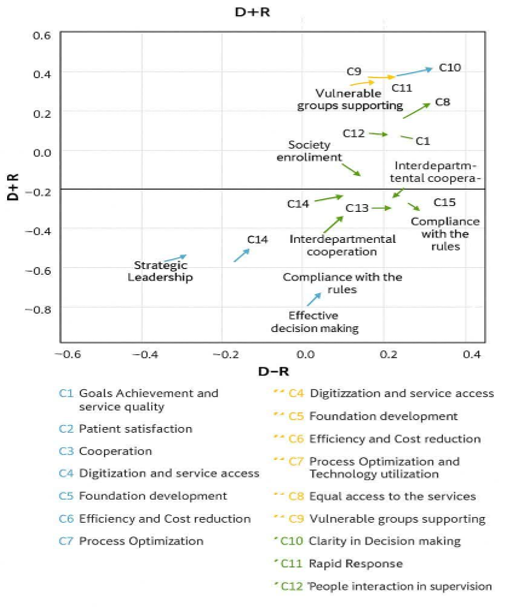
Figure 1. Coordinates (D+R, D−R) of components
Full-Text: (62 Views)
Introduction
The health system, as one of the most critical pillars of sustainable development, plays a fundamental role in enhancing the quality of life of citizens [1]. Governance within this system is influenced by a set of managerial, economic, and social factors that affect the efficiency and effectiveness of healthcare services [2]. However, numerous challenges such as a lack of transparency in decision-making processes, inefficiencies in resource allocation, inequities in access to medical services, and weaknesses in accountability have hindered the realization of effective governance, resulting in adverse consequences for public health [3]. This situation underscores the urgent need for a more in-depth examination of governance mechanisms in the health system and for identifying the interrelationships among influencing factors.
Good governance in the health system is based on principles such as transparency, accountability, equity, and participation. Collectively, these principles lay the groundwork for optimal management and the sustainable delivery of healthcare services. Studies conducted in this field have demonstrated that the application of these principles leads to increased public trust, improved productivity, and reduced costs within the healthcare system [1]. Nonetheless, in many countries, the effective implementation of these principles is confronted by structural and institutional barriers, necessitating a more comprehensive analysis. In Iran as well, despite efforts made to improve healthcare system governance, challenges persist in the effective implementation of policies and the oversight of system performance [4].
Previous research indicates that a comprehensive understanding of governance in the health system requires the simultaneous examination of the influencing components and their interactions. One of the most significant gaps in the existing literature is the lack of comprehensive analytical models capable of systematically explaining these relationships. Many existing studies have focused merely on identifying influential indicators, rather than exploring causal relationships among various factors.
The present study aims to address this gap by analyzing the causal relationships among key governance factors in the Iran’s health system. The focus of this study is on analyzing both the influence and dependency of variables such as transparency, accountability, equity, and efficiency within an integrated framework. Achieving such an understanding could pave the way for designing more effective policies and facilitate decision-making processes for managers and policymakers seeking to improve health system performance. To this end, the study employs appropriate analytical methods to extract the relationships among these variables and aims to present a practical model that can be utilized in future policy-making and planning efforts.
Methods
This study employs a mixed-methods approach. In the qualitative phase, data were collected through semi-structured interviews. The participants included managers and experts in the healthcare sector at selected children hospitals, as well as academic faculty members. Participants were selected using non-probability snowball sampling. Initially, a list of experts familiar with the research topic was compiled. Interviews were conducted with those who expressed willingness to participate, subsequently; additional interviews were conducted with other experts introduced by the initial participants. The sampling and interview process continued until theoretical saturation was reached and no new or substantive information emerged.
In total, 17 experts, including university scholars and managers in the health and treatment sector, such as officials and specialists from the Ministry of Health and Medical Education and academic experts in the health system, were selected. The duration of interviews ranged from 30 to 60 minutes.
The qualitative data were analyzed using thematic analysis, applying the six-phase inductive thematic analysis method introduced by Braun and Clarke [5], which is recognized as a rigorous and credible technique for analyzing qualitative data. To enhance the credibility and validity of the analysis, initial coding was reviewed after a short interval, and a second researcher was involved as a co-coder to verify the codes. Additionally, to ensure the validity, the results of the data analysis were shared with the participants, and their additional feedback was collected.
In the quantitative phase, a questionnaire and the Decision Making Trial and Evaluation Laboratory (DEMATEL) technique were employed to investigate the relationships among the research variables. Sampling at this phase was conducted in a manner similar to the qualitative phase, due to the expert-based nature of the technique. The validity of the measurement instrument was assessed by reviewing the relevant literature and consulting with experts. This phase was conducted between March 2024 to November 2024, and efforts were made to minimize bias in the results by incorporating diverse perspectives.
The DEMATEL technique is a pairwise comparison–based multi-criterion decision-making method. This technique is used to identify causal relationship patterns among a set of variables. It reveals causal and effect relationships, showing both the influence exerted by and received by factors. Using this method, experts can express their opinions with greater precision regarding the direction and intensity of effects among factors.
In this study, to determine influential and influenced criteria and to construct the research model, the DEMATEL method was employed according to the standard procedure described by Dew and Lee, as follows.
Step 1) Formation of the direct-relation matrix (M): To identify the relationship pattern among n criteria, an n×n matrix is first constructed. The influence of the elements in each row on the elements in the columns is recorded in this matrix. When multiple experts participate, each expert completes the matrix independently. Then, a simple average of the experts’ opinions is calculated to form the direct-relation matrix (X).
.PNG)
Step 2) Normalization of the direct-relation matrix: For normalization, the sum of each row and each column of the direct-relation matrix is calculated. The maximum sum among these is denoted by k, and each element of the direct-relation matrix is then divided by k to obtain the normalized matrix.
.PNG)
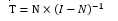
Step 3) Calculation of the total-relation matrix: After normalization, the total-relation matrix is computed based on the following relation:
.PNG)
An n×n identity matrix (with 1s on the diagonal and 0s elsewhere) is formed. This identity matrix minus the normalized matrix is inverted, and the result is multiplied by the normalized matrix to obtain the total-relation matrix.
Step 4) Calculation of the internal-relation matrix: To calculate the internal-relation matrix, a threshold value must be determined. This step filters out insignificant relationships and enables construction of a reliable relationship network, known as the network relation map (NRM). Only relationships with values in matrix T exceeding the threshold are included in the NRM.
The threshold is calculated as the average of all values in matrix T. In this study, the threshold value was 0.264. Consequently, all values in matrix T below 0.264 were set to zero, meaning those causal relationships are disregarded.
Step 5: Final output and construction of the causal diagram: The next step involves calculating the sums of rows (D) and columns (R) of matrix T. These are computed using the following formulas:

Using D and R, the values D+R and D−R are calculated, which respectively represent the total interaction of the factors and their net influence power.
Results
Qualitative findings: In the initial phase of familiarization with the data, 80 verbal statements identified from the interview transcripts were labeled as initial codes (concepts). Subsequently, these initial codes were organized into 41 sub-themes, which were then grouped under seven main themes. The final results obtained from this categorization are presented in Table 1.
The health system, as one of the most critical pillars of sustainable development, plays a fundamental role in enhancing the quality of life of citizens [1]. Governance within this system is influenced by a set of managerial, economic, and social factors that affect the efficiency and effectiveness of healthcare services [2]. However, numerous challenges such as a lack of transparency in decision-making processes, inefficiencies in resource allocation, inequities in access to medical services, and weaknesses in accountability have hindered the realization of effective governance, resulting in adverse consequences for public health [3]. This situation underscores the urgent need for a more in-depth examination of governance mechanisms in the health system and for identifying the interrelationships among influencing factors.
Good governance in the health system is based on principles such as transparency, accountability, equity, and participation. Collectively, these principles lay the groundwork for optimal management and the sustainable delivery of healthcare services. Studies conducted in this field have demonstrated that the application of these principles leads to increased public trust, improved productivity, and reduced costs within the healthcare system [1]. Nonetheless, in many countries, the effective implementation of these principles is confronted by structural and institutional barriers, necessitating a more comprehensive analysis. In Iran as well, despite efforts made to improve healthcare system governance, challenges persist in the effective implementation of policies and the oversight of system performance [4].
Previous research indicates that a comprehensive understanding of governance in the health system requires the simultaneous examination of the influencing components and their interactions. One of the most significant gaps in the existing literature is the lack of comprehensive analytical models capable of systematically explaining these relationships. Many existing studies have focused merely on identifying influential indicators, rather than exploring causal relationships among various factors.
The present study aims to address this gap by analyzing the causal relationships among key governance factors in the Iran’s health system. The focus of this study is on analyzing both the influence and dependency of variables such as transparency, accountability, equity, and efficiency within an integrated framework. Achieving such an understanding could pave the way for designing more effective policies and facilitate decision-making processes for managers and policymakers seeking to improve health system performance. To this end, the study employs appropriate analytical methods to extract the relationships among these variables and aims to present a practical model that can be utilized in future policy-making and planning efforts.
Methods
This study employs a mixed-methods approach. In the qualitative phase, data were collected through semi-structured interviews. The participants included managers and experts in the healthcare sector at selected children hospitals, as well as academic faculty members. Participants were selected using non-probability snowball sampling. Initially, a list of experts familiar with the research topic was compiled. Interviews were conducted with those who expressed willingness to participate, subsequently; additional interviews were conducted with other experts introduced by the initial participants. The sampling and interview process continued until theoretical saturation was reached and no new or substantive information emerged.
In total, 17 experts, including university scholars and managers in the health and treatment sector, such as officials and specialists from the Ministry of Health and Medical Education and academic experts in the health system, were selected. The duration of interviews ranged from 30 to 60 minutes.
The qualitative data were analyzed using thematic analysis, applying the six-phase inductive thematic analysis method introduced by Braun and Clarke [5], which is recognized as a rigorous and credible technique for analyzing qualitative data. To enhance the credibility and validity of the analysis, initial coding was reviewed after a short interval, and a second researcher was involved as a co-coder to verify the codes. Additionally, to ensure the validity, the results of the data analysis were shared with the participants, and their additional feedback was collected.
In the quantitative phase, a questionnaire and the Decision Making Trial and Evaluation Laboratory (DEMATEL) technique were employed to investigate the relationships among the research variables. Sampling at this phase was conducted in a manner similar to the qualitative phase, due to the expert-based nature of the technique. The validity of the measurement instrument was assessed by reviewing the relevant literature and consulting with experts. This phase was conducted between March 2024 to November 2024, and efforts were made to minimize bias in the results by incorporating diverse perspectives.
The DEMATEL technique is a pairwise comparison–based multi-criterion decision-making method. This technique is used to identify causal relationship patterns among a set of variables. It reveals causal and effect relationships, showing both the influence exerted by and received by factors. Using this method, experts can express their opinions with greater precision regarding the direction and intensity of effects among factors.
In this study, to determine influential and influenced criteria and to construct the research model, the DEMATEL method was employed according to the standard procedure described by Dew and Lee, as follows.
Step 1) Formation of the direct-relation matrix (M): To identify the relationship pattern among n criteria, an n×n matrix is first constructed. The influence of the elements in each row on the elements in the columns is recorded in this matrix. When multiple experts participate, each expert completes the matrix independently. Then, a simple average of the experts’ opinions is calculated to form the direct-relation matrix (X).
Step 2) Normalization of the direct-relation matrix: For normalization, the sum of each row and each column of the direct-relation matrix is calculated. The maximum sum among these is denoted by k, and each element of the direct-relation matrix is then divided by k to obtain the normalized matrix.
Step 3) Calculation of the total-relation matrix: After normalization, the total-relation matrix is computed based on the following relation:
An n×n identity matrix (with 1s on the diagonal and 0s elsewhere) is formed. This identity matrix minus the normalized matrix is inverted, and the result is multiplied by the normalized matrix to obtain the total-relation matrix.
Step 4) Calculation of the internal-relation matrix: To calculate the internal-relation matrix, a threshold value must be determined. This step filters out insignificant relationships and enables construction of a reliable relationship network, known as the network relation map (NRM). Only relationships with values in matrix T exceeding the threshold are included in the NRM.
The threshold is calculated as the average of all values in matrix T. In this study, the threshold value was 0.264. Consequently, all values in matrix T below 0.264 were set to zero, meaning those causal relationships are disregarded.
Step 5: Final output and construction of the causal diagram: The next step involves calculating the sums of rows (D) and columns (R) of matrix T. These are computed using the following formulas:
Using D and R, the values D+R and D−R are calculated, which respectively represent the total interaction of the factors and their net influence power.
Results
Qualitative findings: In the initial phase of familiarization with the data, 80 verbal statements identified from the interview transcripts were labeled as initial codes (concepts). Subsequently, these initial codes were organized into 41 sub-themes, which were then grouped under seven main themes. The final results obtained from this categorization are presented in Table 1.
Table 1. Summary of thematic analysis results
| Main theme | Sub-theme | Frequency in interviews | Code |
| Effectiveness | Goal achievement and service quality | 3 | C1 |
| Patient satisfaction | 5 | C2 | |
| Collaboration | 4 | C3 | |
| Efficiency | Digitalization and service access | 3 | C4 |
| Infrastructure development | 5 | C5 | |
| Productivity and cost reduction | 4 | C6 | |
| Process optimization and technology use | 3 | C7 | |
| Equity | Equal access to services | 6 | C8 |
| Support for vulnerable groups | 2 | C9 | |
| Transparency and accountability | Decision-making transparency | 3 | C10 |
| Rapid accountability | 3 | C11 | |
| Public participation in supervision | 4 | C12 | |
| Participation | Community participation | 5 | C13 |
| Intersectoral cooperation | 4 | C14 | |
| Legality | Compliance with laws and regulations | 4 | C15 |
| Legal monitoring and evaluation | 3 | C16 | |
| Leadership | Strategic leadership | 4 | C17 |
| Effective decision-making | 3 | C18 |
DEMATEL findings: Table 2 presents the direct-relation matrix, which corresponds to the pairwise comparisons made by the experts. Table 3 shows the Normalized direct-relation matrix and Table 4 presents the total-relation matrix. The pattern of significant relationships is also presented in Table 5
Table 2. Direct relationship matrix
| C1 | C2 | C3 | C4 | C5 | C6 | C7 | C8 | C9 | C10 | C11 | C12 | C13 | C14 | C15 | C16 | C17 | C18 | |
| C1 | 0 | 3.455 | 3.273 | 2.727 | 1.636 | 1.545 | 3.091 | 2.636 | 2.727 | 2.091 | 3.636 | 2.091 | 1.091 | 1.455 | 1.364 | 1 | 1 | 1.818 |
| C2 | 3.455 | 0 | 3.636 | 2.818 | 2.091 | 1.636 | 2.273 | 2.455 | 2.909 | 2.182 | 3.727 | 2.455 | 1.727 | 2.545 | 1.091 | 0.909 | 0.818 | 1.727 |
| C3 | 3.455 | 3.455 | 0 | 2.909 | 2.364 | 1.909 | 2.909 | 2.455 | 2.636 | 2.636 | 3.455 | 2.545 | 1.818 | 3.455 | 1.545 | 1.273 | 1.091 | 1.545 |
| C4 | 2.818 | 3.364 | 3.091 | 0 | 2.636 | 2.182 | 3.091 | 2.636 | 2.364 | 2.273 | 2.818 | 2.455 | 2 | 2.364 | 1.727 | 1.364 | 1.364 | 2.091 |
| C5 | 1.818 | 2.273 | 2.364 | 2.455 | 0 | 2 | 2.818 | 2.636 | 2.182 | 2.273 | 2.818 | 2.455 | 2.091 | 2 | 2.273 | 2.091 | 1.455 | 2.273 |
| C6 | 1.545 | 1.545 | 1.727 | 2 | 2.455 | 0 | 3.273 | 2.455 | 2.636 | 2.909 | 2.182 | 2.909 | 3.273 | 2.727 | 2.909 | 2.909 | 3.364 | 2.545 |
| C7 | 3.273 | 3 | 3 | 2.818 | 3.091 | 2.909 | 0 | 3 | 2.727 | 2.727 | 3.091 | 2.909 | 2.818 | 2.545 | 2.636 | 2.364 | 2.273 | 2.636 |
| C8 | 2.364 | 2.727 | 2.545 | 2.818 | 3.091 | 2.909 | 3.091 | 0 | 2.818 | 2.727 | 2.909 | 2.364 | 2.455 | 2.273 | 2.273 | 2.364 | 2.182 | 2.182 |
| C9 | 2.909 | 3.182 | 2.909 | 2.545 | 2.545 | 2.636 | 2.727 | 2.909 | 0 | 2.909 | 3.364 | 2.909 | 1.818 | 2.455 | 1.818 | 1.636 | 2 | 2.091 |
| C10 | 2.273 | 2.455 | 2.182 | 1.818 | 2 | 2.545 | 2.727 | 2.909 | 2.455 | 0 | 2.364 | 2.909 | 2.909 | 1.909 | 1.727 | 2.091 | 1.818 | 1.818 |
| C11 | 3.455 | 3.636 | 3.273 | 3.455 | 2.818 | 2.818 | 2.818 | 3 | 3.182 | 2.909 | 0 | 2.909 | 2.455 | 2.364 | 2.273 | 2.545 | 2.455 | 2.091 |
| C12 | 1.727 | 1.727 | 1.909 | 2 | 2.455 | 3.091 | 3.182 | 2.818 | 2.273 | 2.818 | 2.727 | 0 | 3.182 | 2.273 | 2.636 | 2.727 | 2.182 | 2 |
| C13 | 0.909 | 0.545 | 0.727 | 1.182 | 1.909 | 2.909 | 2.636 | 2.545 | 1.455 | 3.091 | 2.182 | 1.909 | 0 | 3.182 | 2.636 | 2.182 | 1.636 | 2 |
| C14 | 1.091 | 1.636 | 2.636 | 2.455 | 2.091 | 2.455 | 2.636 | 2 | 1.182 | 1.273 | 1.818 | 2.273 | 2.909 | 0 | 2.455 | 2.545 | 2 | 2.455 |
| C15 | 1.182 | 0.727 | 1.455 | 1.273 | 2.636 | 3 | 2.818 | 2.455 | 1.545 | 1.818 | 1.818 | 2.818 | 2.818 | 2.273 | 0 | 2.727 | 3.273 | 2.455 |
| C16 | 1.091 | 0.909 | 1.455 | 1.364 | 2.455 | 3.091 | 3.091 | 2.636 | 1.909 | 2.455 | 1.727 | 2.818 | 3.182 | 2.455 | 3.455 | 0 | 2.909 | 2.273 |
| C17 | 0.909 | 0.909 | 1.182 | 0.909 | 1.545 | 3.182 | 2.545 | 2.545 | 1.818 | 2.182 | 2 | 2.182 | 2.091 | 1.909 | 2.818 | 2.818 | 0 | 1.909 |
| C18 | 1.909 | 1.818 | 1.727 | 1.909 | 2 | 2.182 | 2.545 | 2.182 | 1.909 | 2.273 | 1.909 | 1.636 | 1.727 | 1.727 | 2.091 | 2.636 | 1.818 | 0 |
Table 3. Normalized direct correlation matrix
| C1 | C2 | C3 | C4 | C5 | C6 | C7 | C8 | C9 | C10 | C11 | C12 | C13 | C14 | C15 | C16 | C17 | C18 | |
| C1 | 0 | 0.071 | 0.068 | 0.056 | 0.034 | 0.032 | 0.064 | 0.054 | 0.056 | 0.043 | 0.075 | 0.043 | 0.023 | 0.03 | 0.028 | 0.021 | 0.021 | 0.038 |
| C2 | 0.071 | 0 | 0.075 | 0.058 | 0.043 | 0.034 | 0.047 | 0.051 | 0.06 | 0.045 | 0.077 | 0.051 | 0.036 | 0.053 | 0.023 | 0.019 | 0.017 | 0.036 |
| C3 | 0.071 | 0.071 | 0 | 0.06 | 0.049 | 0.039 | 0.06 | 0.051 | 0.054 | 0.054 | 0.071 | 0.053 | 0.038 | 0.071 | 0.032 | 0.026 | 0.023 | 0.032 |
| C4 | 0.058 | 0.069 | 0.064 | 0 | 0.054 | 0.045 | 0.064 | 0.054 | 0.049 | 0.047 | 0.058 | 0.051 | 0.041 | 0.049 | 0.036 | 0.028 | 0.028 | 0.043 |
| C5 | 0.038 | 0.047 | 0.049 | 0.051 | 0 | 0.041 | 0.058 | 0.054 | 0.045 | 0.047 | 0.058 | 0.051 | 0.043 | 0.041 | 0.047 | 0.043 | 0.03 | 0.047 |
| C6 | 0.032 | 0.032 | 0.036 | 0.041 | 0.051 | 0 | 0.068 | 0.051 | 0.054 | 0.06 | 0.045 | 0.06 | 0.068 | 0.056 | 0.06 | 0.06 | 0.069 | 0.053 |
| C7 | 0.068 | 0.062 | 0.062 | 0.058 | 0.064 | 0.06 | 0 | 0.062 | 0.056 | 0.056 | 0.064 | 0.06 | 0.058 | 0.053 | 0.054 | 0.049 | 0.047 | 0.054 |
| C8 | 0.049 | 0.056 | 0.053 | 0.058 | 0.064 | 0.06 | 0.064 | 0 | 0.058 | 0.056 | 0.06 | 0.049 | 0.051 | 0.047 | 0.047 | 0.049 | 0.045 | 0.045 |
| C9 | 0.06 | 0.066 | 0.06 | 0.053 | 0.053 | 0.054 | 0.056 | 0.06 | 0 | 0.06 | 0.069 | 0.06 | 0.038 | 0.051 | 0.038 | 0.034 | 0.041 | 0.043 |
| C10 | 0.047 | 0.051 | 0.045 | 0.038 | 0.041 | 0.053 | 0.056 | 0.06 | 0.051 | 0 | 0.049 | 0.06 | 0.06 | 0.039 | 0.036 | 0.043 | 0.038 | 0.038 |
| C11 | 0.071 | 0.075 | 0.068 | 0.071 | 0.058 | 0.058 | 0.058 | 0.062 | 0.066 | 0.06 | 0 | 0.06 | 0.051 | 0.049 | 0.047 | 0.053 | 0.051 | 0.043 |
| C12 | 0.036 | 0.036 | 0.039 | 0.041 | 0.051 | 0.064 | 0.066 | 0.058 | 0.047 | 0.058 | 0.056 | 0 | 0.066 | 0.047 | 0.054 | 0.056 | 0.045 | 0.041 |
| C13 | 0.019 | 0.011 | 0.015 | 0.024 | 0.039 | 0.06 | 0.054 | 0.053 | 0.03 | 0.064 | 0.045 | 0.039 | 0 | 0.066 | 0.054 | 0.045 | 0.034 | 0.041 |
| C14 | 0.023 | 0.034 | 0.054 | 0.051 | 0.043 | 0.051 | 0.054 | 0.041 | 0.024 | 0.026 | 0.038 | 0.047 | 0.06 | 0 | 0.051 | 0.053 | 0.041 | 0.051 |
| C15 | 0.024 | 0.015 | 0.03 | 0.026 | 0.054 | 0.062 | 0.058 | 0.051 | 0.032 | 0.038 | 0.038 | 0.058 | 0.058 | 0.047 | 0 | 0.056 | 0.068 | 0.051 |
| C16 | 0.023 | 0.019 | 0.03 | 0.028 | 0.051 | 0.064 | 0.064 | 0.054 | 0.039 | 0.051 | 0.036 | 0.058 | 0.066 | 0.051 | 0.071 | 0 | 0.06 | 0.047 |
| C17 | 0.019 | 0.019 | 0.024 | 0.019 | 0.032 | 0.066 | 0.053 | 0.053 | 0.038 | 0.045 | 0.041 | 0.045 | 0.043 | 0.039 | 0.058 | 0.058 | 0 | 0.039 |
| C18 | 0.039 | 0.038 | 0.036 | 0.039 | 0.041 | 0.045 | 0.053 | 0.045 | 0.039 | 0.047 | 0.039 | 0.034 | 0.036 | 0.036 | 0.043 | 0.054 | 0.038 | 0 |
Table 4. Total-relation matrix
| C1 | C2 | C3 | C4 | C5 | C6 | C7 | C8 | C9 | C10 | C11 | C12 | C13 | C14 | C15 | C16 | C17 | C18 | |
| C1 | 0.196 | 0.269 | 0.272 | 0.254 | 0.242 | 0.253 | 0.308 | 0.281 | 0.259 | 0.258 | 0.304 | 0.263 | 0.232 | 0.238 | 0.222 | 0.208 | 0.196 | 0.223 |
| C2 | 0.269 | 0.21 | 0.286 | 0.263 | 0.258 | 0.263 | 0.303 | 0.287 | 0.269 | 0.268 | 0.314 | 0.278 | 0.252 | 0.266 | 0.225 | 0.214 | 0.199 | 0.229 |
| C3 | 0.282 | 0.289 | 0.231 | 0.279 | 0.278 | 0.284 | 0.333 | 0.303 | 0.278 | 0.292 | 0.325 | 0.296 | 0.27 | 0.298 | 0.248 | 0.235 | 0.217 | 0.239 |
| C4 | 0.266 | 0.282 | 0.285 | 0.217 | 0.279 | 0.285 | 0.33 | 0.301 | 0.269 | 0.281 | 0.308 | 0.289 | 0.268 | 0.273 | 0.247 | 0.233 | 0.219 | 0.246 |
| C5 | 0.233 | 0.248 | 0.257 | 0.251 | 0.215 | 0.269 | 0.31 | 0.287 | 0.252 | 0.267 | 0.292 | 0.276 | 0.258 | 0.253 | 0.247 | 0.236 | 0.211 | 0.238 |
| C6 | 0.246 | 0.253 | 0.265 | 0.263 | 0.286 | 0.256 | 0.347 | 0.31 | 0.282 | 0.304 | 0.305 | 0.309 | 0.306 | 0.291 | 0.283 | 0.275 | 0.269 | 0.265 |
| C7 | 0.305 | 0.307 | 0.317 | 0.304 | 0.323 | 0.337 | 0.314 | 0.348 | 0.31 | 0.326 | 0.352 | 0.336 | 0.321 | 0.312 | 0.299 | 0.285 | 0.267 | 0.288 |
| C8 | 0.271 | 0.285 | 0.29 | 0.287 | 0.305 | 0.318 | 0.351 | 0.269 | 0.293 | 0.307 | 0.328 | 0.306 | 0.296 | 0.289 | 0.275 | 0.268 | 0.25 | 0.263 |
| C9 | 0.28 | 0.292 | 0.295 | 0.28 | 0.292 | 0.309 | 0.341 | 0.322 | 0.236 | 0.308 | 0.334 | 0.313 | 0.28 | 0.289 | 0.263 | 0.251 | 0.243 | 0.258 |
| C10 | 0.244 | 0.253 | 0.256 | 0.242 | 0.257 | 0.282 | 0.312 | 0.296 | 0.26 | 0.226 | 0.287 | 0.287 | 0.277 | 0.255 | 0.239 | 0.239 | 0.22 | 0.232 |
| C11 | 0.313 | 0.324 | 0.327 | 0.32 | 0.322 | 0.34 | 0.373 | 0.352 | 0.322 | 0.334 | 0.297 | 0.34 | 0.317 | 0.313 | 0.295 | 0.291 | 0.273 | 0.281 |
| C12 | 0.245 | 0.251 | 0.263 | 0.258 | 0.28 | 0.309 | 0.338 | 0.31 | 0.27 | 0.296 | 0.308 | 0.246 | 0.298 | 0.276 | 0.271 | 0.265 | 0.241 | 0.249 |
| C13 | 0.188 | 0.187 | 0.198 | 0.2 | 0.226 | 0.26 | 0.276 | 0.256 | 0.211 | 0.255 | 0.248 | 0.238 | 0.193 | 0.249 | 0.231 | 0.217 | 0.195 | 0.21 |
| C14 | 0.203 | 0.219 | 0.245 | 0.235 | 0.241 | 0.262 | 0.289 | 0.258 | 0.217 | 0.233 | 0.255 | 0.256 | 0.259 | 0.199 | 0.237 | 0.232 | 0.21 | 0.228 |
| C15 | 0.208 | 0.205 | 0.227 | 0.217 | 0.257 | 0.28 | 0.3 | 0.274 | 0.229 | 0.249 | 0.261 | 0.272 | 0.265 | 0.249 | 0.196 | 0.243 | 0.24 | 0.234 |
| C16 | 0.217 | 0.219 | 0.238 | 0.23 | 0.265 | 0.294 | 0.318 | 0.29 | 0.247 | 0.273 | 0.272 | 0.285 | 0.283 | 0.264 | 0.274 | 0.2 | 0.243 | 0.241 |
| C17 | 0.188 | 0.192 | 0.205 | 0.194 | 0.219 | 0.264 | 0.273 | 0.256 | 0.218 | 0.238 | 0.245 | 0.242 | 0.233 | 0.225 | 0.234 | 0.228 | 0.162 | 0.208 |
| C18 | 0.212 | 0.215 | 0.22 | 0.217 | 0.23 | 0.247 | 0.276 | 0.252 | 0.223 | 0.242 | 0.248 | 0.235 | 0.227 | 0.224 | 0.221 | 0.225 | 0.198 | 0.171 |
Table 5. Significant relationships (interactions)
| C1 | C2 | C3 | C4 | C5 | C6 | C7 | C8 | C9 | C10 | C11 | C12 | C13 | C14 | C15 | C16 | C17 | C18 | |
| C1 | 0 | 0.269 | 0.272 | 0 | 0 | 0 | 0.308 | 0.281 | 0 | 0 | 0.304 | 0 | 0 | 0 | 0 | 0 | 0 | 0 |
| C2 | 0.269 | 0 | 0.286 | 0 | 0 | 0 | 0.303 | 0.287 | 0.269 | 0.268 | 0.314 | 0.278 | 0 | 0.266 | 0 | 0 | 0 | 0 |
| C3 | 0.282 | 0.289 | 0 | 0.279 | 0.278 | 0.284 | 0.333 | 0.303 | 0.278 | 0.292 | 0.325 | 0.296 | 0.27 | 0.298 | 0 | 0 | 0 | 0 |
| C4 | 0.266 | 0.282 | 0.285 | 0 | 0.279 | 0.285 | 0.33 | 0.301 | 0.269 | 0.281 | 0.308 | 0.289 | 0.268 | 0.273 | 0 | 0 | 0 | 0 |
| C5 | 0 | 0 | 0 | 0 | 0 | 0.269 | 0.31 | 0.287 | 0 | 0.267 | 0.292 | 0.276 | 0 | 0 | 0 | 0 | 0 | 0 |
| C6 | 0 | 0 | 0.265 | 0 | 0.286 | 0 | 0.347 | 0.31 | 0.282 | 0.304 | 0.305 | 0.309 | 0.306 | 0.291 | 0.283 | 0.275 | 0.269 | 0.265 |
| C7 | 0.305 | 0.307 | 0.317 | 0.304 | 0.323 | 0.337 | 0.314 | 0.348 | 0.31 | 0.326 | 0.352 | 0.336 | 0.321 | 0.312 | 0.299 | 0.285 | 0.267 | 0.288 |
| C8 | 0.271 | 0.285 | 0.29 | 0.287 | 0.305 | 0.318 | 0.351 | 0.269 | 0.293 | 0.307 | 0.328 | 0.306 | 0.296 | 0.289 | 0.275 | 0.268 | 0 | 0 |
| C9 | 0.28 | 0.292 | 0.295 | 0.28 | 0.292 | 0.309 | 0.341 | 0.322 | 0 | 0.308 | 0.334 | 0.313 | 0.28 | 0.289 | 0 | 0 | 0 | 0 |
| C10 | 0 | 0 | 0 | 0 | 0 | 0.282 | 0.312 | 0.296 | 0 | 0 | 0.287 | 0.287 | 0.277 | 0 | 0 | 0 | 0 | 0 |
| C11 | 0.313 | 0.324 | 0.327 | 0.32 | 0.322 | 0.34 | 0.373 | 0.352 | 0.322 | 0.334 | 0.297 | 0.34 | 0.317 | 0.313 | 0.295 | 0.291 | 0.273 | 0.281 |
| C12 | 0 | 0 | 0 | 0 | 0.28 | 0.309 | 0.338 | 0.31 | 0.27 | 0.296 | 0.308 | 0 | 0.298 | 0.276 | 0.271 | 0.265 | 0 | 0 |
| C13 | 0 | 0 | 0 | 0 | 0 | 0 | 0.276 | 0 | 0 | 0 | 0 | 0 | 0 | 0 | 0 | 0 | 0 | 0 |
| C14 | 0 | 0 | 0 | 0 | 0 | 0 | 0.289 | 0 | 0 | 0 | 0 | 0 | 0 | 0 | 0 | 0 | 0 | 0 |
| C15 | 0 | 0 | 0 | 0 | 0 | 0.28 | 0.3 | 0.274 | 0 | 0 | 0 | 0.272 | 0.265 | 0 | 0 | 0 | 0 | 0 |
| C16 | 0 | 0 | 0 | 0 | 0.265 | 0.294 | 0.318 | 0.29 | 0 | 0.273 | 0.272 | 0.285 | 0.283 | 0.264 | 0.274 | 0 | 0 | 0 |
| C17 | 0 | 0 | 0 | 0 | 0 | 0 | 0.273 | 0 | 0 | 0 | 0 | 0 | 0 | 0 | 0 | 0 | 0 | 0 |
| C18 | 0 | 0 | 0 | 0 | 0 | 0 | 0.276 | 0 | 0 | 0 | 0 | 0 | 0 | 0 | 0 | 0 | 0 | 0 |
Finally, the values of D+R and D−R are calculated. The final results are presented in Table 6. Figure 1 illustrates the pattern of significant (mutual) relationships in a diagram. The vertical axis represents
Table 6. Final output
| Components | Code | R | D | D+R | D-R | Role |
| Goal achievement and service quality | C1 | 4.366 | 4.477 | 8.843 | 0.111 | Influential |
| Patient satisfaction | C2 | 4.499 | 4.655 | 9.155 | 0.156 | Influential |
| Collaboration | C3 | 4.679 | 4.977 | 9.656 | 0.298 | Influential |
| Digitalization and service access | C4 | 4.512 | 4.877 | 9.389 | 0.365 | Influential |
| Infrastructure development | C5 | 4.775 | 4.6 | 9.375 | -0.175 | Effective |
| Productivity and cost reduction | C6 | 5.112 | 5.116 | 10.227 | 0.004 | Influential |
| Process optimization and technology use | C7 | 5.693 | 5.651 | 11.344 | -0.042 | Effective |
| Equal access to services | C8 | 5.253 | 5.252 | 10.505 | -0.001 | Effective |
| Support for vulnerable groups | C9 | 4.642 | 5.187 | 9.83 | 0.545 | Influential |
| Decision-making transparency | C10 | 4.959 | 4.662 | 9.621 | -0.297 | Effective |
| Rapid accountability | C11 | 5.282 | 5.735 | 11.017 | 0.453 | Influential |
| Public participation in supervision | C12 | 5.066 | 4.974 | 10.04 | -0.091 | Effective |
| Community participation | C13 | 4.836 | 4.038 | 8.874 | -0.798 | Effective |
| Intersectoral cooperation | C14 | 4.763 | 4.279 | 9.042 | -0.484 | Effective |
| Compliance with laws and regulations | C15 | 4.51 | 4.405 | 8.914 | -0.105 | Effective |
| Legal monitoring and evaluation | C16 | 4.343 | 4.654 | 8.997 | 0.311 | Influential |
| Strategic leadership | C17 | 4.055 | 4.026 | 8.08 | -0.029 | Effective |
| Effective decision-making | C18 | 4.304 | 4.083 | 8.387 | -0.221 |
| Effective |
Discussion
The findings of this study revealed that governance in the health system is dependent on a set of key components, each of which exerts reciprocal influence over the others and plays a vital role in the policy-making and implementation processes of health programs. The thematic analysis identified various dimensions of governance grouped into seven categories: effectiveness, efficiency, equity, transparency and accountability, participation, legality, and leadership, each comprising distinct subcomponents.
DEMATEL analysis, employed to assess the degree of influence and dependence among these components, indicated that “rapid accountability” held the highest influence within the health governance system. This indicates that this variable plays a decisive role in shaping other factors. Conversely, process optimization and technology utilization exhibited the highest dependence, suggesting that this variable is heavily influenced by other factors and requires effective policy interventions to strengthen it.
Analysis of the D+R and D−R vectors indicated that components such as goal achievement and service quality, patient satisfaction, collaboration and participation, and rapid accountability function as causal variables, meaning they determine the improvement of other factors. In contrast, variables such as process optimization and technology use, equitable access to services, public participation in oversight, and strategic leadership were identified as effect variables, suggesting that improving these areas requires a greater focus on the causal variables.
A study by Rahimi et al. [6], aiming to designing a causal model for good governance criteria in the health system, showed that managers’ strategic insight had the highest level of influence, while managerial effectiveness was the most influenced. Additionally, adequate resource allocation, including financial, informational, and physical resources, for effective program implementation demonstrated the most interaction with other criteria. Other important criteria, in descending order, included managerial efficiency, meritocracy, client participation, strategic insight, training in modern health system methods and approaches, equal advancement opportunities for staff, capital accumulation and management in the health sector, effectiveness, anti-corruption efforts, simplification of regulations, crisis management, development of appropriate strategies for achieving health system goals and addressing health challenges, rule of law, transparency, and managerial accountability. The study concluded that empowered leadership can initiate improvements and sustainable development in the health system through long- and short-term health development programs, emphasizing freedom of expression, inclusive participation, equitable legal frameworks, and free access to information.
Figure 1. Coordinates (D+R, D−R) of components
In another study by Azadian et al. [7], which applied a fuzzy hierarchical analysis to evaluate components of good governance for Iran health policy, rule of law was ranked as the most important component. It was followed by consensus-building, transparency, accountability, equity and fairness, effectiveness and efficiency, and ethical governance. This study reaffirms the view that good governance offers a renewed interpretation of principles such as democracy, human rights, and justice, serving as a framework for advancing human-centered development goals. The authors recommend prioritizing executive strategies to strengthen governance components in the seventh national development plan.
According to Rajaei [8] study, aimed at identifying and prioritizing good governance components in the healthcare sector using network analysis and DEMATEL, transparency ranked first with a weight of 0.312, followed by accountability (0.189) and anti-corruption (0.172). Moreover, the influence of transparency, accountability, regulatory quality, and anti-corruption was greater than their degree of dependence. The study concluded that identifying and implementing governance components in the healthcare sector can help promote social justice, equal opportunity, and health improvement indicators. Mohammadiha and et al., [9] showed that for governance issues, strategies such as strategic orientation, balanced and integrated stewardship, value-based and ethical orientation, optimal management of financial resources, promotion of administrative health, and development of knowledge resources are needed.
According to Rajaei [8] study, aimed at identifying and prioritizing good governance components in the healthcare sector using network analysis and DEMATEL, transparency ranked first with a weight of 0.312, followed by accountability (0.189) and anti-corruption (0.172). Moreover, the influence of transparency, accountability, regulatory quality, and anti-corruption was greater than their degree of dependence. The study concluded that identifying and implementing governance components in the healthcare sector can help promote social justice, equal opportunity, and health improvement indicators. Mohammadiha and et al., [9] showed that for governance issues, strategies such as strategic orientation, balanced and integrated stewardship, value-based and ethical orientation, optimal management of financial resources, promotion of administrative health, and development of knowledge resources are needed.
For contractual issues, strategies for developing technical knowledge, developing an executive and operational platform, and managing the capacity to provide services are required. In addition, strategies for developing stakeholder participation are also needed for participatory issues. The coefficient of determination for governance, contractual, and participatory issues was 0.674, 0.605, and 0.551, respectively.. The study concluded that improving the health system necessitates paying serious attention to these issues simultaneously and using the capacity of the private sector and civil society in addition to the government's capabilities.
Alikhani et al. [10] investigated the impact of key factors on a network governance model in health using structural equation modeling. Factors such as opportunistic behavior, trust, commitment, information sharing, and knowledge sharing were examined. Results showed that commitment and information sharing had the most significant direct positive impact on network governance. Conversely, opportunistic behavior had a strong negative effect on trust, thereby negatively influencing governance. The authors recommend that prioritizing trust and commitment in designing of an optimal network governance model, emphasizing and that information sharing can further enhance governance. Moreover, the model should be structured to minimize opportunistic behavior among actors.
Limitations
One limitation of this study was restricted access to experts and specialists, as well as the exclusive participation of individuals based in children’s hospitals.
Conclusion
Enhancing intersectoral collaboration and supporting vulnerable populations improves equity and equal access to health services, while rapid accountability and transparency in decision-making are key factors in strengthening health governance. Research highlights the importance of simultaneously examining and integrating governance components to improve policymaking. Data-driven decision-making can help reduce policy conflicts. Components such as transparency, accountability, and feedback management significantly contribute to optimizing policy processes.
The framework presented in this study emphasizes efficiency, infrastructure development, and process optimization as priorities for enhancing health governance in Iran. The application of analytical models such as DEMATEL can support policymakers in prioritizing actions and allocating resources effectively, ultimately contributing to a more efficient and equitable health system.
Declarations
Ethical considerations: This study was approved by the Ethics Committee of Arak University of Medical Sciences with the ethical code IR.ARAKMU.REC.1403.335. All ethical principles of the Helsinki Declaration were observed, including informed consent from participants and the confidentiality of their information.
Funding: No financial support was received from any public, commercial, or non-profit funding agencies.
Conflict of interest: The authors declare no conflict of interest.
Author Contributions: DSH: Conceptualization, study design, data curation, methodology, software, validation, data analysis, resources, writing– original draft, writing– review & editing, visualization; MMS: Conceptualization, study design, methodology, validation, writing– review & editing, supervision, final approval; KHAM: Conceptualization, study design, methodology, validation, final approval; AA: Methodology, validation, final approval.
Consent for publication: Not applicable.
Data availability: Data from this study are available from the corresponding author upon request, with a valid justification.
AI deceleration: The authors used ChatGPT artificial intelligence for editing the English section of this article. All AI-edited content was reviewed and approved by the authors.
Acknowledgements: The authors express their sincere gratitude to all participants who contributed to this study.
Online supplement
Interview Guide
Type of Study: Research |
Subject:
Health Policy
Received: 2025/04/12 | Accepted: 2025/09/20 | Published: 2025/12/8
Received: 2025/04/12 | Accepted: 2025/09/20 | Published: 2025/12/8
Supplement [PDF 72 KB] (37 Download)
Send email to the article author
| Rights and permissions | |
 |
This work is licensed under a Creative Commons Attribution-NonCommercial 4.0 International License. |
Site Keywords
Health, Administration, Scientific Article, Iran University of Medical Sciences,
